As salesforce has given us the functionality of report and dashboard to create chart then what is the use of visualforce charting?.
In some situations existing functionality of salesforce can not meet our requirement properly . Suppose there is a requirement to compose custom pages that combine charts and data tables in ways that are more useful to our organization.In that case visual force charting is useful.There are also other way to meet this requirement. We can use Google chart Api for this.In my previous post I have explained.
Visualforce charting gives you an easy way to create customized business charts, based on data sets you create directly from SOQL queries, or by building the data set in your own Apexcode. By combining and configuring individual data series, you can compose charts that display your data in ways meaningful to your organization.
Visualforce charts are rendered client-side using JavaScript. This allows charts to be animated and visually exciting, and chart data can load and reload asynchronously, which can make the page feel more responsive.
This is the my page and controller.
<apex:page controller="OppsControllernew" tabStyle="Account">
<apex:form >
<apex:pageBlock >
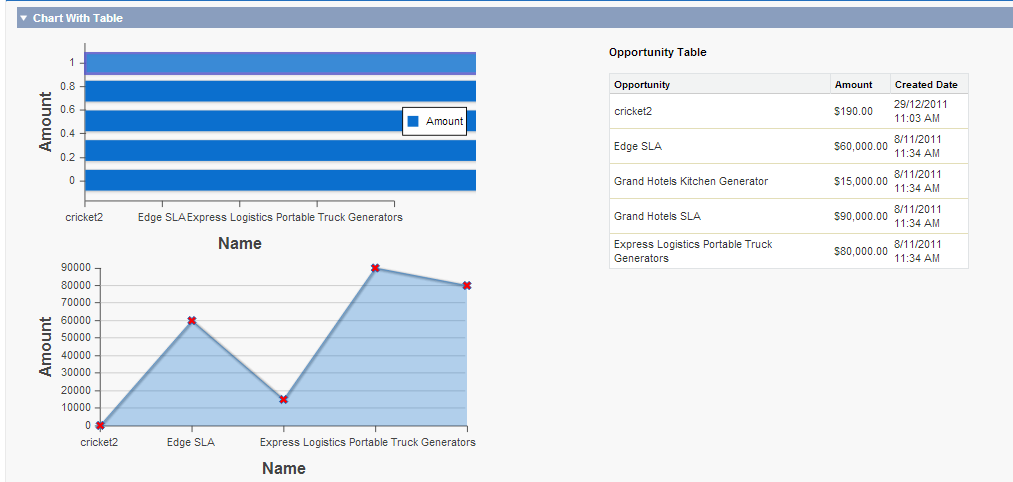
<apex:pageBlockSection title="Chart With Table">
<apex:outputPanel style="float:left;">
<apex:chart data="{!Opportunities}" width="500" height="250">
<apex:axis type="Numeric" position="left" fields="Amount" title="Amount"/>
<apex:axis type="Category" position="bottom" fields="Name" title="Name"/>
<apex:barSeries orientation="horizontal" axis="left" xField="Amount" yField="Name"/>
<!--<apex:pieSeries dataField="amount" labelField="name"/>-->
<apex:legend position="right"/>
</apex:chart>
<apex:chart data="{!Opportunities}" width="500" height="250">
<apex:axis type="Category" position="bottom" fields="Name" title="Name" />
<apex:axis type="Numeric" position="left" fields="Amount" title="Amount" grid="true"/>
<apex:lineSeries axis="left" fill="true" xField="Name" yField="Amount" markerType="cross" markerSize="4" markerFill="#FF0000"/>
</apex:chart>
</apex:outputPanel>
<apex:outputPanel style="float:right;margin-right:4cm;height:600px;width:400px;" >
<p><b> Opportunity Table</b></p><br/>
<apex:pageBlockTable value="{!Opportunities}" var="opp">
<apex:column headerValue="Opportunity" value="{!opp.Name}"/>
<apex:column headerValue="Amount" value="{!opp.amount}"/>
<apex:column headerValue="Created Date" value="{!opp.createddate}" style="width:80px"/>
</apex:pageBlockTable>
</apex:outputPanel>
</apex:pageBlockSection>
</apex:pageBlock>
</apex:form>
</apex:page>
<apex:form >
<apex:pageBlock >
<apex:pageBlockSection title="Chart With Table">
<apex:outputPanel style="float:left;">
<apex:chart data="{!Opportunities}" width="500" height="250">
<apex:axis type="Numeric" position="left" fields="Amount" title="Amount"/>
<apex:axis type="Category" position="bottom" fields="Name" title="Name"/>
<apex:barSeries orientation="horizontal" axis="left" xField="Amount" yField="Name"/>
<!--<apex:pieSeries dataField="amount" labelField="name"/>-->
<apex:legend position="right"/>
</apex:chart>
<apex:chart data="{!Opportunities}" width="500" height="250">
<apex:axis type="Category" position="bottom" fields="Name" title="Name" />
<apex:axis type="Numeric" position="left" fields="Amount" title="Amount" grid="true"/>
<apex:lineSeries axis="left" fill="true" xField="Name" yField="Amount" markerType="cross" markerSize="4" markerFill="#FF0000"/>
</apex:chart>
</apex:outputPanel>
<apex:outputPanel style="float:right;margin-right:4cm;height:600px;width:400px;" >
<p><b> Opportunity Table</b></p><br/>
<apex:pageBlockTable value="{!Opportunities}" var="opp">
<apex:column headerValue="Opportunity" value="{!opp.Name}"/>
<apex:column headerValue="Amount" value="{!opp.amount}"/>
<apex:column headerValue="Created Date" value="{!opp.createddate}" style="width:80px"/>
</apex:pageBlockTable>
</apex:outputPanel>
</apex:pageBlockSection>
</apex:pageBlock>
</apex:form>
</apex:page>
My controller is
public class OppsControllernew {
// Get a set of Opportunities
public ApexPages.StandardSetController setCon {
get {
if(setCon == null) {
setCon = new ApexPages.StandardSetController(Database.getQueryLocator(
[SELECT Name, Type,createddate, Amount, Closedate FROM Opportunity]));
setCon.setPageSize(5);
}
return setCon;
}
set;
}
public List<Opportunity> getOpportunities() {
return (List<Opportunity>) setCon.getRecords();
}
}
A Visualforce chart binds to the source of its data through the data attribute on the <apex:chart> component.
Here data source is sObjects that is Opportunity.
Data can be
- Name of java script function
- Non-Salesforce data sources by building a JavaScript array
- Apex wrapper objects
Limitations Of Visualforce Charting
- Visualforce charts only render in browsers which support scalable vector graphics (SVG).
- Visualforce charts won’t display in pages rendered as PDFs
- Dynamic (Apex-generated) charting components are not supported at this time
Comments